What we don’t know is how big the variation is.
We’re in the data industry and talk to growers, agronomists and stakeholders every day. We know how valuable it is to the vast majority of people in the industry to have good soil data.
For anyone in agriculture using precision ag principles, important decisions are often made based on only one or two digits. Decision makers rely on the accuracy of data.
If you’re a grower in Western Canada or an ag input expert in Iowa, you should expect comparable results.
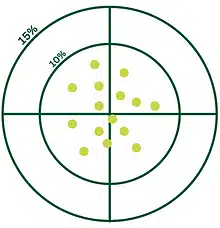
We all have an acceptable level of variation that we can work with. For some it’s 5%, for some it’s more like 20%. Most industry actors we talk with agree around the 10 to 15% mark.
Will 10 samples sent to 10 different labs yield exactly the same results? No.
Will the same 10 samples be within a variability range that we can work with and use to make good decisions? They should.
We tried to find out what the variation was between labs.
The same composite can yield different results.
To find out what to expect in terms of variation of results from lab to lab, we collected 25 four-core composites in our research field.
We split these 25 composites into 4 parts each that we then sent to 4 different labs across the US and Canada and had them analyzed with the same methodology.
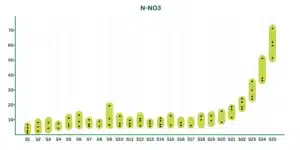
The end results depicted below show the analysis results for all 25 composites, each dot representing a lab result for said composite.
The results
We expected variations between labs, but it was a surprise to see the range of variation.
48%
Across all measured nutrients and all composites, the variation percentage between the max value and the minimum value given by the labs for each composite was on average around 48%. That’s far from the expected 10-15% most of our clients ask for.
MAPE (Mean Absolute Percentage Error) is an accuracy measure based on the relative percentage of errors. The closer the MAPE value is to zero, the better the predictions. It represents the average percentage error between the max value and the min value given by the labs for each composite. In other words, it’s the average variation in range observed.
Some variations were definitely within a more than acceptable range like Buffer pH at only 1% while some others like Nitrate Nitrogen below were more dramatic with a variation of 91%. Each black point represent a lab result.
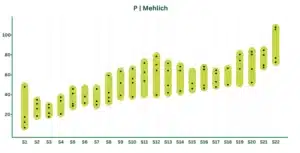
The example below for Phosphorus shows how widely results can vary for a single nutrient. The MAPE we observed, representing the most extreme average variation in range, was 73%.
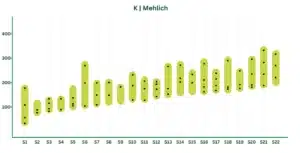
Potassium also saw pretty noticeable variations across all 25 composites. Some were within a few dozen PPM while some other composites more than doubled.
We expected variability, and so do most people in the industry working with soil data. The problematic part is when the data varies too widely, too often.
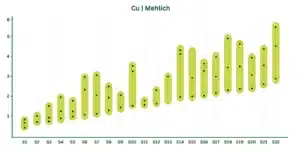
The below extracted results for Cu demonstrate how widely composites varied during our test, making decision-making difficult. While not being dramatic, given we’re talking single-digit ppm values, range was somewhat surprising.
How does ChrysaLabs compare?
Keeping our focus on main nutrients (N, P, K, OM, pH) the results from the ChrysaLabs Probe were in the majority within the same range as what you’d receive from traditional labs.
Out of 25 samples, here’s how many samples returned results within the same range as our benchmark labs.
N : 16 in the same range
We observed 3x less Probe VS Labs data variation than Labs VS Labs
K : 18 in the same range
Observed variation between our results to lab range : 6.7%
P : 15 in the same range
Observed variation between our results to lab range : also 6.7%
OM : 16 in the same range
Observed variation between our results to lab range : 6.6%
PH : 9 in the same range
Not our best comparative results but within 0.9% of labs’ results across all samples.
Those results are very close to the expected 10-15%.
On target & repeatability
It’s impossible for labs to replicate other labs’ results because of inter-lab variability.
Even though the most extreme variations were sometimes high in our experiment, the results were mostly in the same range.
That’s your acceptable variation percentage.
What our experiment showed is that it’s possible to fall outside of that range from time to time.
When that happens, you lose another key metric to put at the top of your analytical list: repeatability.
While you can’t expect results to be the exact same as other labs’ (accuracy), you can expect them to be in the same range (precision). And no matter your chosen method of measurement, it should generate similar results for multiple preparations of the same sample.